
Analysis · Aug 2026 · replay audit of the official FM-Bench runs · a companion to arXiv:2608.18423
FM-Bench has 15 LLMs each run a football club for twenty in-game years (~374 decision stops), and the solo track now runs every model on three separate worlds (seeds 1, 1024 and 2026). This report does not ask "who won the game" — it asks which model capabilities the leaderboard gaps decompose into. Each capability gets a model-level definition, a behavioral metric extracted automatically from the engine logs, and a rank correlation over n=15 models whose per-seed coefficients are shown alongside it. Every measurement comes from bit-exact replay of seed + action log — 45 solo runs and the 15 Arena seats, every final score matching the public board, drift = 0; the game mechanics are only the measurement instrument. The full write-up is the FM-Bench paper, and where a number here and a number there could disagree, the paper is the source of truth.
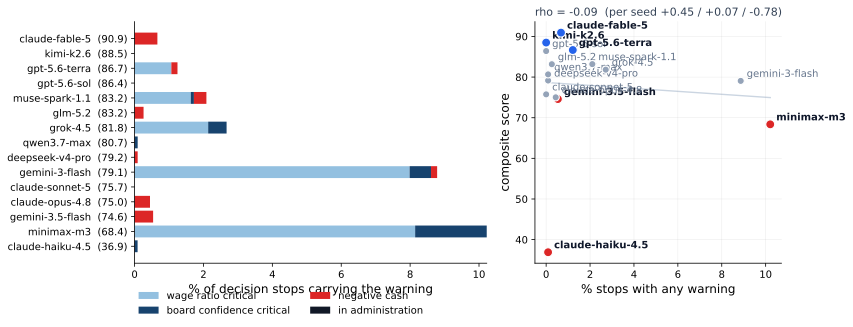
And two metrics failed. Warning exposure and youth harvest both looked informative on seed 1 and flip sign across the three seeds; tactic reversals was dropped as an axis for the same reason. All three are kept in §10 as negative results — a benchmark that only ever reports the metrics that worked is not telling you how it was built.
Each capability is measured through a behavioral metric: objective actions the model left in the logs, never its self-description. Every model contributes the mean of its statistic over the three seeds, and the direction given is the one the matrix axis rewards (game mechanics appear only in the "measurement" column).
| Model capability | Behavioral measurement (game terms) | rs vs final score | per seed | Fig |
|---|---|---|---|---|
| Endgame awareness | long-horizon actions per season (invest + promote_youth), years 17–20 minus years 2–16 (low is better) | −0.58 | −0.31 / −0.34 / −0.28 | Fig 4 |
| Credit assignment | idle-cash ratio: season-end cash ÷ net worth, mean over seasons 2–20 (low is better) | −0.50 | −0.74 / −0.60 / −0.34 | Fig 5 |
| Proactive control | renewal lead: contract months remaining when a renewal episode opens, median (high is better) | +0.45 | +0.68 / +0.18 / +0.47 | Fig 6 |
| Price discovery | offers per completed signing: successful make_transfer_offer calls ÷ senior arrivals with a fee (low is better; oracle = 1.0) | descriptive | field median 30 | Fig 7/8 |
| Memory curation | TF–IDF (1–2 gram) cosine similarity between consecutive season-end notebooks (distance from the ~0.35 band is what the axis scores) | band, not slope | — | Fig 9 |
| Compute efficiency | tokens by manifest accounting (input + output + cache read + cache write); the axis scores score per million tokens | −0.19 p=0.50 | +0.07 / −0.23 / −0.15 | Fig 10/11 |
Limitations. ① Three seeds bound the solo board: enough to show that adjacent models do not separate and that spread differs sharply by model, not enough for inferential claims about any single pair. The Arena is one shared seed-7 world with no error bars. ② A behavioral metric is not the capability itself — it can be confounded by other traits (§10 has two that demonstrably are), and coefficients over n=15 are indicative. ③ Arena action timing maps each seat's stop index linearly onto its tenure (~19 stops per club-year) and is approximate; solo timing is replay-exact. ④ Notebook similarity uses TF–IDF rather than neural embeddings, for determinism and zero external dependencies; a semantic-embedding replication is future work. ⑤ Correlation is not causation — the causal probes that would upgrade these metrics, notebook ablation and plan injection, remain future work.
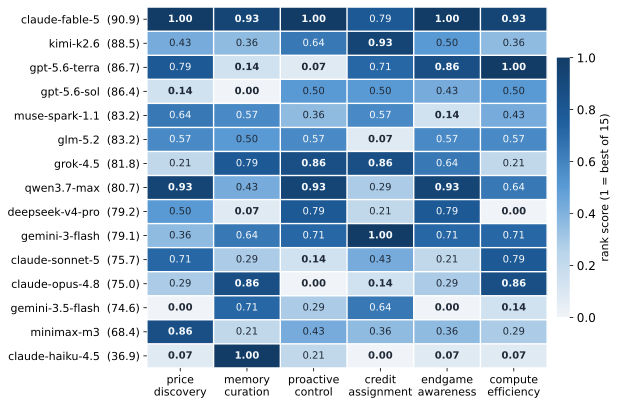
How to read it: the #1 model is a generalist — claude-fable-5 has no axis below 0.79 and a mean of 0.94 — and it leads only three of the six columns. The mid-table pairs a genuine strength with a decisive gap: gemini-3-flash keeps the best cash discipline in the field (46% idle cash against a field median of 90%) and still ranks tenth, because it is the model least willing to cut long-horizon spending as the horizon ends. qwen3.7-max holds the longest renewal leads after the winner and gives it back through a 103% idle ratio and a notebook it rewrites every season.
The bottom of the board is not one failure but several at once: claude-haiku-4.5 pairs the highest idle cash in the field with the shortest renewal leads and a rising endgame investment rate. Score behaves like a function of the whole bundle; there is no single winning trick, which is why decomposing one composite number was worth doing.
Rank scores are a visualization-grade aggregation over n=15 models (each column's definition is in §1); the evidentiary weight rests on the raw metrics in the sections below.
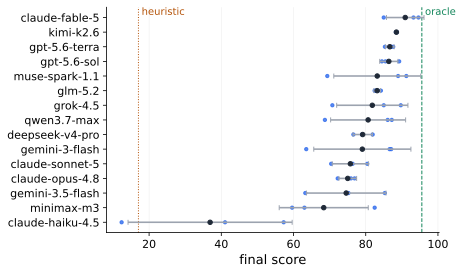
The first thing three seeds buy is an honest error bar, and it is not uniform. Per-model spread runs from 0.15 for kimi-k2.6 — a third of a point across three different worlds — to 22.73 for claude-haiku-4.5, and four models swing by more than 20 points. A strong mean can hide a collapse: muse-spark-1.1 is strong on two worlds and 20 points weaker on the third, and gemini-3-flash collapses on the hardest seed. Rows that sit within a few points of each other on the board are ties, and should be read that way.
What did not move is the shape of the result. Every model completed every horizon on all three seeds, while the blind scripted anchors died out in 7 of their 9 runs — including the disciplined heuristic, the script that does everything a manager should do mechanically, without judgment about which season it is. The oracle, a scripted policy whose only privilege is reading the hidden state through the same 26 tools and the same per-stop budgets, averages 95.54 ± 4.68; claude-fable-5 reaches 90.94 without seeing any of it. Both sit at roughly two-thirds of a loose upper bound of ≈145, so the scale is not saturated.
Nor does the horizon shorten safely. On seed 1 the best-to-worst gap widens from 17.2 points at year 5 to 37.3 at year 20, the rank correlation with the final order climbs from 0.19 at year 5 to 0.78 at year 15, and deepseek-v4-pro leads on score at both year 5 and year 10 yet finishes 12th, while the eventual winner is 5th at year 5. A five-year benchmark on this same engine would have ranked a different set of models.
Capability: a 20-year run ends, and slow-payoff actions stop being investments once there is no time left to collect. Measurement: the late-minus-mid shift in facility and academy actions — the rate over years 17–20 minus the rate over years 2–16.
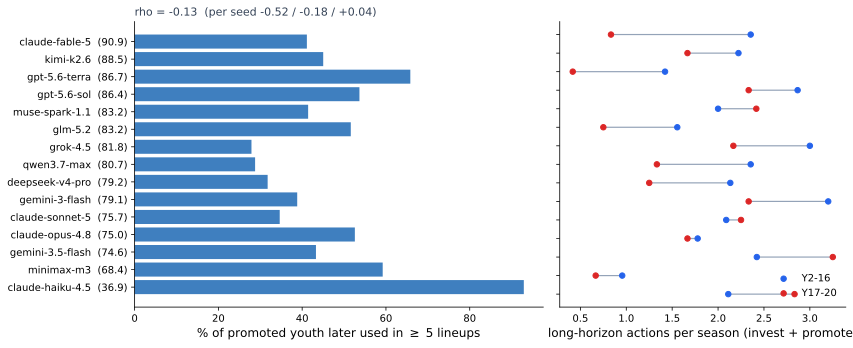
This is the capability that tracks the score most closely, at rs=−0.58, with the same sign on every seed (−0.31 / −0.34 / −0.28). The winner cuts hardest, from 2.4 to 0.8 long-horizon actions a season, and gpt-5.6-terra from 1.4 to 0.4. gemini-3.5-flash instead raises them from 2.4 to 3.3, and is still building facilities in year 19 — a facility that cannot finish, let alone pay back, before the run is graded.
Rational endgame behavior under a finite horizon is a question only a long benchmark can pose. In a twenty-step episode it does not exist.
Capability: valuing a present cost against a distant return. In LLM agents it shows up as a systematic bias: holding cash is always the locally safest action — it never triggers an immediate downside and it keeps the board's finance check green — but its opportunity cost only materializes seasons later.
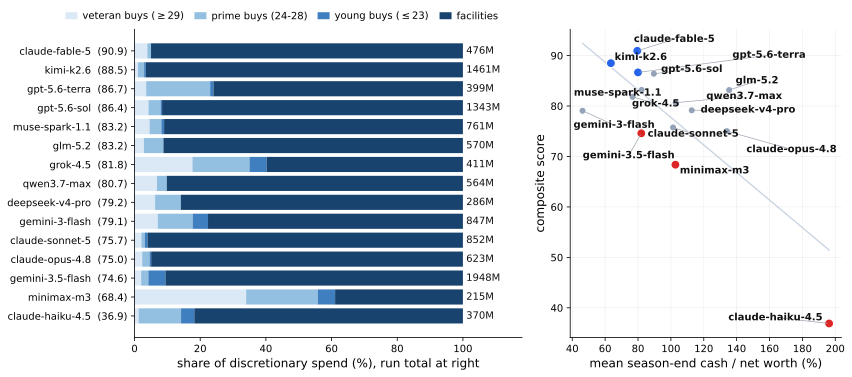
Net worth books excess cash at a discount, so a ratio above 100% means the idle pile exceeds the club's entire discounted worth — and the bottom of the board sits there. claude-haiku-4.5 averages 196%, glm-5.2 135%, claude-opus-4.8 134%, against 80% for the winner and a field median of 90%. The correlation is rs=−0.50 and negative on all three seeds (−0.74 / −0.60 / −0.34).
The left panel is the spending side of the same capability, and it is the control that makes the result interpretable: total facility investment is uncorrelated with score. gemini-3.5-flash pushes the most discretionary money through the club of anyone in the field (1,948M) and finishes 13th; the winner spends 476M; minimax-m3 spends 215M. Whether money keeps moving is the signal, not how much of it goes out.
The Arena supplies the cleanest single case of the failure, because there the model says out loud what it does not do. claude-opus-4.8 wrote at Y10 that idle cash should be deployed on quality, and at Y19 that its reserves were discounted and should become young players — then finished holding some 2,100M in idle reserves. The plan was right and the execution never happened; this is a knowing–doing gap, not a knowledge gap.
Capability: the operational definition of planning is "declare early, execute on time". Its mirror image is event-driven control: waiting until the environment pushes the problem into view. Measurement: for a fully foreseeable future event — a contract expiring, with the date visible for years — how far in advance the model acts. Offers to the same player within 60 game-days collapse into one episode.
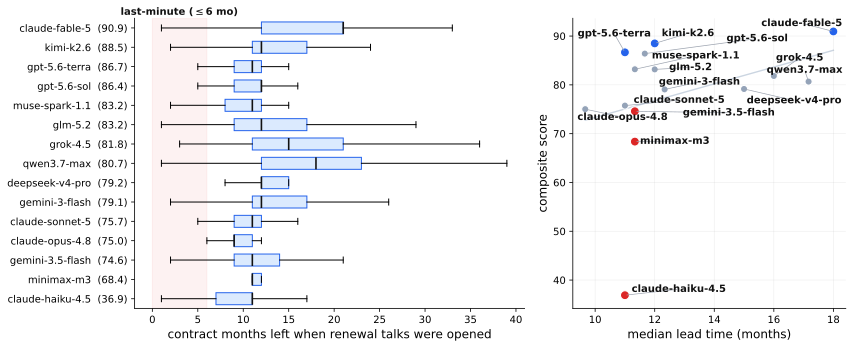
The winner opens renewal negotiations a median of 18 months before expiry, with only 4% of episodes opened inside the final six months. claude-opus-4.8 opens at a median of 10 months with 20% last-minute, and claude-haiku-4.5 at 11 months with 21%. The correlation is +0.45, positive on every seed (+0.68 / +0.18 / +0.47).
Nobody in this comparison is short of information: expiry dates are perfectly predictable, so being driven by them is a difference in control style, not in what the model could see. And the policy is not the winner's private trick — qwen3.7-max holds the longest renewal leads after it, and one first-play human derived the same rule from first principles, signing every contract for the maximum length because ability grows and money inflates.
Capability: the market's asking prices are hidden, a rejected bid raises the hidden ask, and repeated dealings with the same club raise its prices. Finding the acceptance boundary is inference from feedback on your own actions. Measurement: transfer offers submitted per completed signing.
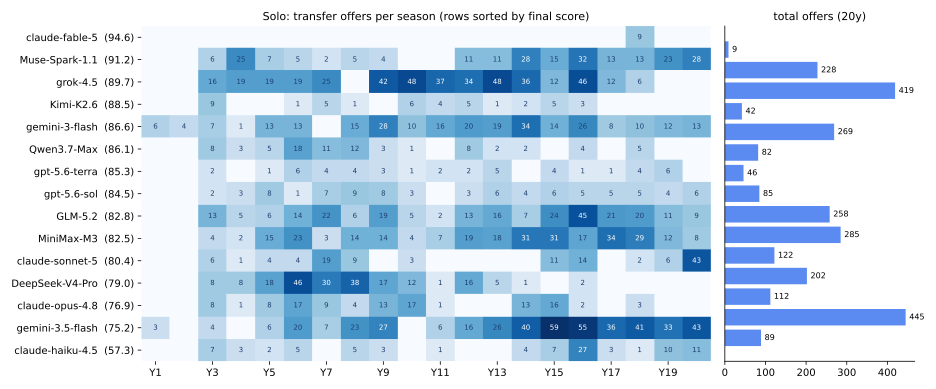
The oracle bids each seller's true accept threshold and closes every buy on the first offer, which fixes the reference at 1.0 offers per signing. No model comes close: the field median is 30, the best model (claude-fable-5) needs 9, and gemini-3.5-flash needs 73, with single seeds as high as 133. After twenty years and hundreds of rejections, no model has located the boundary. The low completion rate in the solo market is a pricing failure, not an empty market.
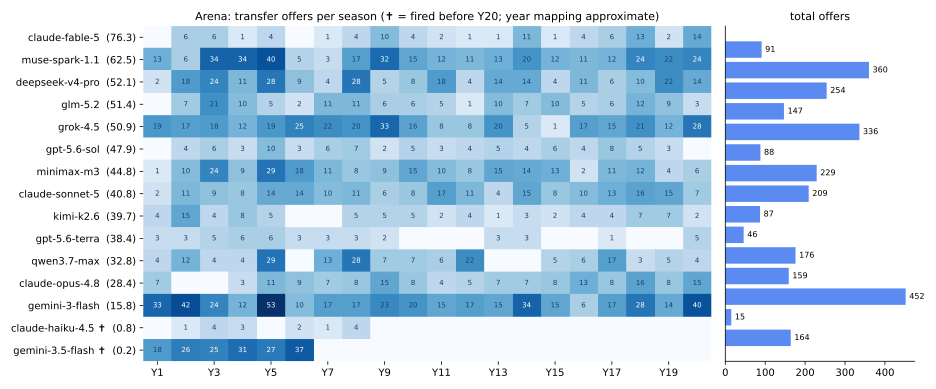
That last contrast is what separates a habit from a judgment. The winner bid 0.5 times per season against the fixed solo opponents and 4.6 times per season in the contested Arena market. Volume itself buys nothing: gemini-3-flash issued 452 offers and 2,642 total actions in the Arena — against the winner's 1,315 — and finished 13th, its notebook resetting to season-local firefighting at every crisis. Table position bought by heavy early activity did not survive the horizon.
Capability: ~374 decision stops exceed any context window, and every stop opens as a fresh conversation with no chat history. Whatever the agent wants its future self to know, it has to write down — so curation is part of what is being measured, not a harness feature. Measurement: each model's notebook is reconstructed at every season end under exact engine semantics, and consecutive states are compared by TF–IDF cosine similarity: 1 means the text never changes, 0 means a full rewrite.
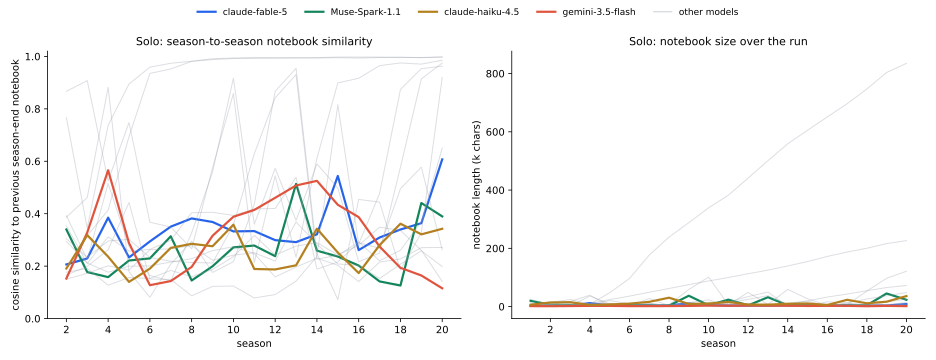
The similarity axis separates two opposite failures. Archivists append and never consolidate: gpt-5.6-sol sits at 0.91 and deepseek-v4-pro at 0.81, and the current state drowns in its own history. Churners rewrite wholesale: claude-sonnet-5 at 0.20 and qwen3.7-max at 0.23, so no plan survives long enough to be executed. The winner sits at 0.39 against a field median of 0.31, holding a stable strategy skeleton while rewriting the state each season.
The right panel is why the two panels have to be read together: the same "high consistency" is a 200k-character append-only archive for one model and a 3–6k curated document for the winner. Notebook size at year 20 ranges from 0.4k to 209k characters across the field.
And similarity alone certifies nothing. claude-haiku-4.5 averages 0.31 — as close to the good band as the winner — and finishes last. A well-shaped notebook is necessary, not sufficient; what has to stay stable is the strategy skeleton, and what has to keep changing is the state.
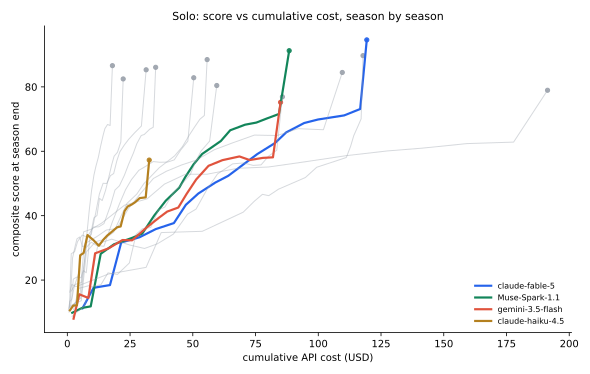
Capability: spending the reasoning budget where it changes a decision. Measurement: tokens per run under manifest accounting, and the season-by-season cost-to-score path.
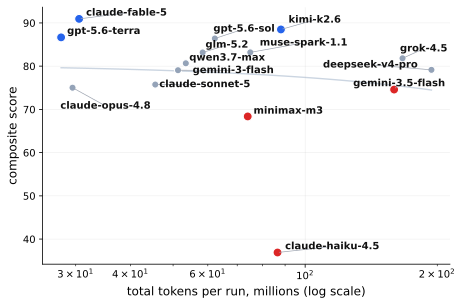
Token spend spans a factor of seven, from 28M for gpt-5.6-terra to 194M for deepseek-v4-pro, and it does not order the board on any seed (+0.07 / −0.23 / −0.15). The null holds under every accounting we tried — cache-inclusive, output-only, and dollars (all p > 0.38, n = 15). Since each model chooses its own number of turns per stop, that spread is a behavioral property of the model, not a harness setting.
Because the correlation is dead, the matrix axis reports efficiency instead — score per million tokens — where gpt-5.6-terra and the winner come out on top and the heaviest spenders fill the bottom. The winner is among the three cheapest models in the field.
Three candidate axes did not survive the second and third seed. They are reported here rather than dropped, because a single-seed result that reverses on replication is exactly what a multi-seed campaign is for.
promote_youth players later fielded in ≥5 lineups. It looked
informative on seed 1 (−0.52) and did not survive the others (−0.18, +0.04), averaging ρ=−0.13 (Fig 3, left
panel). The human players raised the same open question from the other side: the academy is cheap but starts low and
matures slowly, and none of them could tell whether youth investment ever repaid.set_tactics calls whose formation or style differs from the currently active
pair. Dropped as an axis for the same instability, though the raw spread stays wide and worth recording: zero reversals
for the winner in all three worlds, against 31 on average for claude-haiku-4.5.Solo scores are the mean ± SD over the three seeds; the Arena column is the single shared seed-7 world.
| Model | Solo | Arena | Capability profile |
|---|---|---|---|
| claude-fable-5 | 90.9 ± 5.2 | 76.3 | Generalist, no axis below 0.79: best bidder in the field at 9 offers per signing and the sharpest endgame reduction. Tops both boards without leading most single axes. |
| kimi-k2.6 | 88.5 ± 0.1 | 39.7 | The steadiest model in the campaign, scoring within a third of a point on three different worlds. |
| gpt-5.6-terra | 86.7 ± 1.2 | 38.4 | Minimalist: lowest token spend in the field (28M) after the winner, and an early endgame reduction — but the shortest renewal leads among the top models. |
| gpt-5.6-sol | 86.4 ± 2.5 | 47.9 | Archivist memory (similarity 0.91, append-only) and the weakest bidding of the top group at 45 offers per signing. |
| muse-spark-1.1 | 83.2 ± 12.0 | 62.5 | Strong on two worlds and 20 points weaker on the third; one of two models that raise long-horizon spending at the end. |
| glm-5.2 | 83.2 ± 0.9 | 51.4 | Stable across seeds but loose with cash (135% idle ratio). |
| grok-4.5 | 81.8 ± 9.9 | 50.9 | Compute as substitute: long renewal leads and heavy spend (191M tokens), with wide seed-to-seed swings. |
| qwen3.7-max | 80.7 ± 10.4 | 32.8 | Longest renewal leads after the winner, undone by a 103% idle ratio and churning memory (similarity 0.23). |
| deepseek-v4-pro | 79.2 ± 2.7 | 52.1 | Near-static notebook (0.81) and the heaviest spend in the field (194M tokens). |
| gemini-3-flash | 79.1 ± 13.5 | 15.8 | Best cash discipline in the field (46%) but the least willing to cut endgame spending; collapses on the hardest seed. |
| claude-sonnet-5 | 75.7 ± 5.0 | 40.8 | Churning memory (0.20, the lowest in the field) and no endgame reduction. |
| claude-opus-4.8 | 75.0 ± 2.5 | 28.4 | Shortest renewal leads in the field (10 months) with a 134% idle ratio — and, in the Arena, the knowing–doing gap written down in its own notebook. |
| gemini-3.5-flash | 74.6 ± 11.0 | 0.2 | Worst price discovery (73 offers per signing) and the largest endgame ramp-up; still building facilities in year 19. |
| minimax-m3 | 68.4 ± 12.3 | 44.8 | Prefers veteran signings, short leads, and swings 23 points across seeds. |
| claude-haiku-4.5 | 36.9 ± 22.7 | 0.8 | Weak on every axis at once: 196% idle cash, 11-month leads, a rising endgame rate, and the widest spread in the campaign. |
A sixteenth seat, the scripted heuristic anchor, ran the Arena alongside the models and was the first out of the world at year 2.6. On the solo track the three blind scripts — heuristic 17.05 ± 12.34, idle −0.90 ± 1.86, random −17.21 ± 2.45 — died out in 7 of their 9 runs.