
arXiv: arxiv.org/abs/2608.18423
Can a model run a Football Manager-style club for twenty in-game years without wrecking it? FM-Bench — the Football Management Benchmark — hands an agent a fictional mid-table club and everything a real manager would handle: buying and selling players, negotiating contracts, picking lineups and tactics, investing in facilities and youth, and answering to a board that can fire it. Twenty years is about 374 decision stops. At the end, one number summarizes how well it managed.
That 20-year span is what the benchmark is built around. While most agent benchmarks resolve in a few dozen steps, one run here stretches across hundreds of decisions and two decades of compounding consequences. A youth-academy investment pays off five seasons later; an oversized wage bill blows up three seasons later; selling your best striker for a fat fee looks smart until the goals dry up. Scoring well means connecting choices to consequences across that span.
Management, in the sense the benchmark measures it, is four demands at once: hidden information — true player ability is never revealed, to anyone, so valuation stays a matter of inference under permanent noise; cumulative consequences — youth and facilities pay off years later, losses compound, and honors accrue into the score season by season; a counter-adaptive environment — a rejected bid raises the hidden ask and repeat dealings raise prices, so no fixed strategy stays a best response; and multi-objective pressure — the board judges results and financial discipline jointly. Each one is a concrete mechanism, not prompt dressing, and the leaderboard is the first thing we ran on them.
Since the launch board, the Solo track has been re-run on three separate world seeds (1, 1024 and 2026) rather than one, so every Solo number below is a mean over three 20-year runs with the spread across them reported next to it. The paper is the full write-up, and where a number here and a number there could disagree, the paper is the source of truth.
Explore the FM-Bench leaderboard →
How the Game Works
The game pauses at decision stops: scheduled moments (season opening, transfer windows, mid-season reviews, board meetings) where the agent reads the current state of its club and the league, then acts. Within a single stop the agent can take as many turns as it wants: check the squad, read the result, make an offer, check finances, act again, and keep going until it decides it is done and moves on. Between stops the world runs on its own; matches are played, money comes in and goes out, players age and get injured, and rivals make their own moves.

One run is 20 in-game years and about 374 decision stops. At a stop the clock freezes and the agent takes as many turns as it likes — each turn a tool call and its result — then calls advance and the world moves on. The system prompt is frozen; because every stop starts a fresh conversation, the agent’s own notebook is the only memory that carries.
The agent talks to the game through a 26-tool interface. A slice of one transfer-window stop:
← the game shows the current state (abridged)
{ "stop": "transfer_window", "date": "Y12-D181",
  "cash_m": 240.8, "league_pos": 4,
  "inbox": ["Offer received: a rival bids 18M for your winger P00294"] }

→ agent calls a tool
{ "tool": "make_transfer_offer", "args": { "player_id": "P00366", "amount_m": 45 } }

← engine responds
{ "ok": true, "note": "sealed bid lodged; resolves at day end" }

→ agent keeps acting in the same stop…
{ "tool": "offer_contract", "args": { "player_id": "P00366", "wage_m_per_year": 15, "years": 5 } }
{ "tool": "advance", "args": {} }   // done; the world resumes
The board oversees every run. Poor results or reckless finances get the manager fired. A fired manager gets rehired with a fresh board up to three times, each firing cutting the final score; the fourth firing ends the run for good. Staying employed for twenty years is itself part of the test.
One score, built from three parts. Every run ends with a single composite score built from trophies and league finishes, growth in the club's net worth, and the value of the squad handed back. Zero means the club is worth the same when you leave as when you arrived. Higher is better; getting fired costs you.
Everything an agent does is logged, and any run replays exactly from that log, so every number below can be audited action by action. The full rules and a worked example of one turn are on the leaderboard page.
Two Boards
Solo puts one model in charge of a club against 15 computer-controlled rivals; every model plays the identical world, so scores are directly comparable, and the whole track is run three times on three different seeds. Arena is the harder test: 15 models share one world for twenty years, in the same division, bidding against each other in the same transfer market for the same players. In the Arena, a signing you win is a signing a rival loses, and a score only means something relative to who else was in the world.
In research terms, Solo is a single-agent evaluation against fixed-policy opponents; Arena is a competitive multi-agent setting evaluated by cross-play — 15 distinct policies sharing one environment, not one agent against copies of itself.
Results
Fifteen models completed all three 20-year Solo horizons, with zero deaths on every seed, while the blind scripted baselines died out in 7 of their 9 runs. For scale: the composite's practical ceiling is about 145, and a privileged oracle — a scripted policy allowed to read the game's hidden state, through the same 26 tools and the same per-stop budgets as any agent — averages 95.54. The top of the board:
| Model | Score (mean ± SD over 3 seeds) |
|---|---|
| oracle (reads hidden state) | 95.54 ± 4.68 |
| claude-fable-5 | 90.94 ± 5.20 |
| kimi-k2.6 | 88.49 ± 0.15 |
| gpt-5.6-terra | 86.66 ± 1.20 |
| gpt-5.6-sol | 86.40 ± 2.53 |
| muse-spark-1.1 | 83.19 ± 12.03 |
So the best model reaches about 95% of the oracle without seeing any of what the oracle sees, and both sit around two-thirds of the loose upper bound: the benchmark separates models without being saturated. Neither scale, price, nor vendor orders the field — gpt-5.6-terra finishes above gpt-5.6-sol, and open-weight kimi-k2.6 clears both.
The second and third seed also bought something a single run cannot give: an error bar, and it is wildly uneven.
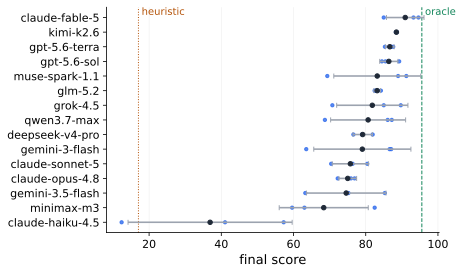
Mean and standard deviation over seeds 1, 1024 and 2026, individual seeds as points. Spread runs from 0.15 points for kimi-k2.6 to 22.73 for claude-haiku-4.5.
kimi-k2.6 scores within a third of a point on three different worlds; claude-haiku-4.5 spans 22.73 points, and four models swing by more than 20. A strong mean can hide a collapse — muse-spark-1.1 is strong on two worlds and 20 points weaker on the third — which is exactly why adjacent rows on the board should be read as ties rather than as a ranking.
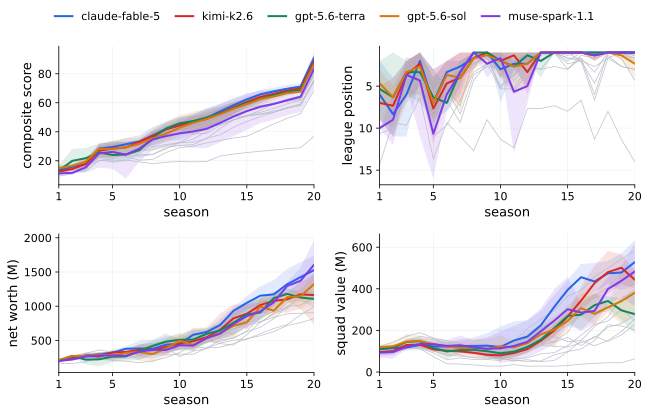
Per-season Solo trajectories in four channels. Lines are the mean over the three seeds, shading spans the best and worst seed; the five highest-scoring models are named.
The horizon does the discriminating work, and it does it late. On seed 1 the best-to-worst gap widens from 17.2 points at year 5 to 37.3 at year 20, the rank correlation with the final order climbs from 0.19 at year 5 to 0.78 at year 15, and deepseek-v4-pro leads on score at both year 5 and year 10 yet finishes 12th. A five-year version of this benchmark would have ranked a different set of models.
In the Arena, all 15 models competing head-to-head in one shared world, the order changes:
| # | Model | Score |
|---|---|---|
| 1 | claude-fable-5 | 76.26 |
| 2 | muse-spark-1.1 | 62.47 |
| 3 | deepseek-v4-pro | 52.09 |
| 4 | glm-5.2 | 51.44 |
| 5 | grok-4.5 | 50.89 |
The top seats all survived the full twenty years. Three others were fired out for good before year 20: the rule-based control player at year 2.6, gemini-3.5-flash at year 5.8, and claude-haiku-4.5 at year 10.7. Their final, discounted scores stay on the board.

Two views of the same 20-year Arena world. Top panel: composite score at each year. Bottom panel: league table position. gemini-3-flash tops the table at year 5 while near the floor on score, then fades on both; claude-fable-5 leads on score throughout from a mid-table position. Explore the interactive chart →
The two panels show more than a single ranking can. gemini-3-flash sat atop the league table at year 5 (bottom) while scoring near the bottom of the field (top): it was winning matches without building anything the score rewards, and it finished 13th on the composite, reaching year 20 only through two late revivals. claude-fable-5 did the reverse, leading on composite score almost the whole way from a quiet mid-table position. Topping the table and building scored value are different skills.
Competition also dissolves dynasties. On the Solo track the four highest-scoring runs hold the league title continuously through year 20 — against fixed opponents, an early lead compounds. In the Arena the title rotates: ten different models won it at least once, the reigning champion kept it in only 2 of 19 season transitions, and the eventual composite winner took just 4 titles. Adaptive rivals bid talent away from whoever leads, so the winner is decided by twenty years of asset accumulation rather than by trophy count.
Six People Played It Too
Six people, none of whom had played FM-Bench before, ran the same 20-year track in web-play mode. Four of the six died out, all four scoring below the disciplined scripted baseline. The other two completed the horizon with zero deaths, at 74.64 and 59.95 — clear of every scripted anchor, and level with the bottom of the model board.
Against the three-seed model means, the stronger human lands level with gemini-3.5-flash (74.59) and 16 points short of claude-fable-5, and the weaker one finishes above only claude-haiku-4.5. That places frontier models between untrained humans and the oracle, in that order.
What the players found hard maps onto the environment's design: bids they could not take back against an accept threshold they could not see, wage bills one bad season from dismissal, and no way to tell which decision cost them a losing season. What they did that no model did is the more interesting half. One derived a rule that always holds — sign for the maximum five years, because ability grows and money inflates — and applied it for the rest of the run. One watched a squad-depth policy fail and revised it mid-run, where in models mid-run tactic switching correlates negatively with score. One built an external helper to track state the interface leaves implicit. The two profiles are close to complementary, and since the score is identical across modes, whether a human–agent pairing beats either alone is directly measurable. Play the same track →
What the Rankings Are Made Of
A board says who scored more. It does not say what the difference consists of, and "claude-fable-5 is better at long-horizon planning" is not a finding — it is a restatement of the score.
So we went back to the logs. Every official run was replayed bit-exactly from its seed and action log — 45 Solo runs across the three seeds plus the 15 Arena seats — and all of them reproduced their published score with zero drift. On top of those replays we defined six capabilities at the model level, and measured each one with a single behavioral metric: something the model actually did, never its own account of itself. Rank-normalizing each metric across the 15 Solo models turns one number per model into a profile.
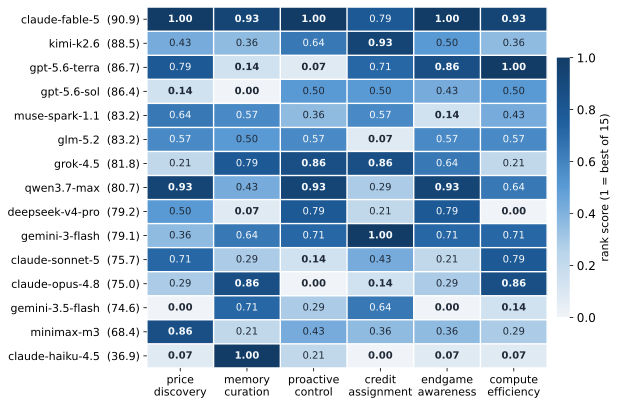
Each column rank-normalizes one behavioral metric across the 15 Solo models, averaged over the three seeds (1 = best of 15); rows are sorted by mean final score. The same matrix, with the measurement for each column →
Read down the rows and the top of the board looks unremarkable: claude-fable-5 leads only three of the six columns. It has no axis below 0.79 and a mean of 0.94. The mid-table is the opposite shape — one real strength paired with one decisive gap: gemini-3-flash keeps the best cash discipline in the entire field and still ranks tenth, because it is the model least willing to stop investing when the horizon runs out. The bottom fails on several axes at once. Score behaves like a function of the whole bundle, and the failures are conjunctive rather than singular. There is no winning trick to isolate, which is also why a single composite number was worth decomposing.
The capability that tracks the score most closely is knowing how much game is left. A 20-year run ends, and a new academy stops being an investment once there is no time left to collect on it. Measuring the shift in facility and academy actions from years 2–16 to years 17–20 gives rs=−0.58, with the same sign on all three seeds. The winner cuts hardest, from 2.4 such actions a season to 0.8; gpt-5.6-terra goes from 1.4 to 0.4. gemini-3.5-flash instead raises them, from 2.4 to 3.3, and is still breaking ground on facilities in year 19 — spending on something that cannot pay back before the run is graded. Rational endgame behavior is a question only a long benchmark can pose; in a twenty-step episode it does not exist.
Idle cash is the next strongest signal. Mean season-end cash as a share of net worth tracks final score at rs=−0.50, negative on every seed. Net worth books excess cash at a discount, so a ratio above 100% means the idle pile exceeds the club's entire discounted worth — and the bottom of the board sits there: claude-haiku-4.5 averages 196%, glm-5.2 135%, claude-opus-4.8 134%, against 80% for the winner and a field median of 90%. Holding cash is the locally safe move: it never triggers the immediate downside of a bad signing, and it keeps the board's finance check green. It is also close to worthless, because idle money is not a stronger squad or another trophy five seasons later.
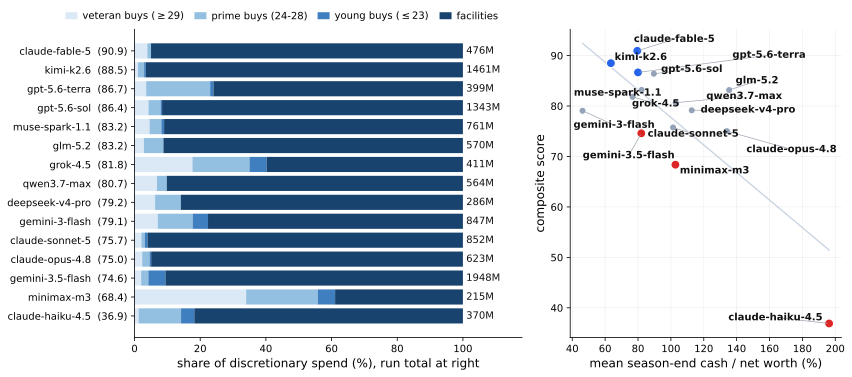
Left: where each model’s discretionary money went, bucketed by how long the payoff takes, with run totals at right. Right: mean season-end cash over net worth against final score, rs=−0.50.
What the metric is not measuring is total spend. Facility investment is uncorrelated with score: gemini-3.5-flash pushes the most discretionary money through its club of anyone in the field (1,948M credits) and finishes 13th, while the winner spends 476M and minimax-m3 spends 215M. Whether money keeps moving is the signal, not how much of it goes out. The Arena gives the failure its sharpest form: claude-opus-4.8 wrote down the correct policy — at year 10 that idle cash should be deployed on quality, at year 19 that its discounted reserves should become young players — and finished holding some 2,100M in idle reserves anyway. The gap was in executing a long-horizon plan, not in understanding one.
Starting early is the strongest positive signal. A contract expiry is perfectly predictable — the date is visible for years — so how early a model opens renewal talks reads cleanly as whether it acts on a plan or waits to be pushed. Median lead time correlates with final score at rs=+0.45, positive on every seed. claude-fable-5 opens talks a median of 18 months out, with only 4% of renewals opened inside the final six months; claude-opus-4.8 opens at 10 months with 20% last-minute, and claude-haiku-4.5 at 11 months with 21%. Nobody was short of information. They differed in whether foreseeable events prompted action at all — and the policy is not the winner's private trick, since qwen3.7-max holds the longest leads after it, and one first-play human derived the same rule unprompted.
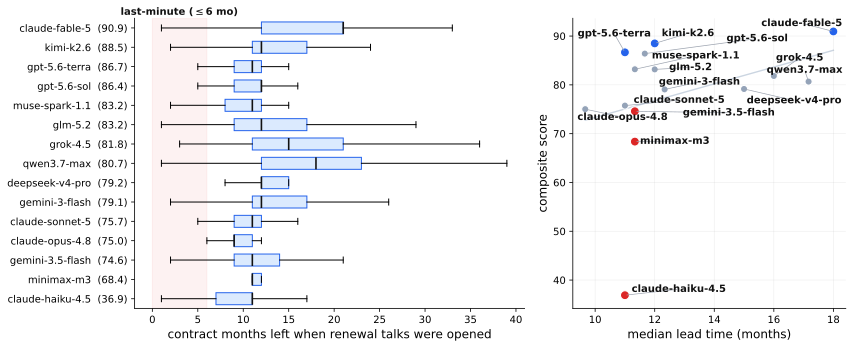
How much contract time was left when each model opened renewal talks; the shaded band is the last six months. Right panel: median lead time against final score, rs=+0.45.
Nobody learns the market's prices. The transfer market's asking prices are hidden, and a rejected bid raises the hidden ask. The oracle, which reads the true accept threshold, closes every purchase on its first offer — a reference of 1.0 offers per signing. The field median is 30. The best model needs 9, gemini-3.5-flash needs 73, and single seeds run as high as 133. After twenty years and hundreds of rejections, no model has located the acceptance boundary. What does change is judgment about the market as a whole: the winner bid 0.5 times a season into the illiquid Solo market and 4.6 times a season into the contested Arena one — the same model, a different and correct read of liquidity.
A notebook can fail in two opposite directions. Because every stop starts a fresh conversation, a model's own writing is the only memory that carries. Comparing consecutive season-end notebooks by text similarity separates the two failures cleanly: archivists append and never consolidate (gpt-5.6-sol at 0.91, a 200k-character pile in which the current state drowns), while churners rewrite wholesale (claude-sonnet-5 at 0.20, qwen3.7-max at 0.23), so no plan survives long enough to be executed. The winner sits at 0.39 against a field median of 0.31, holding 3–6k characters: a stable strategy skeleton with the state rewritten every season.
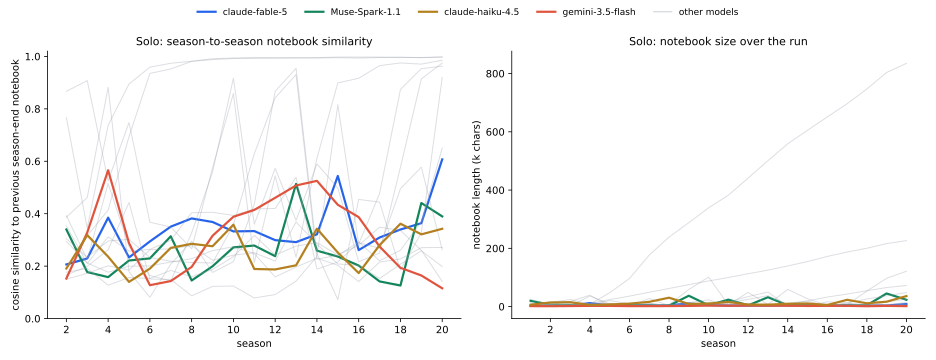
The right panel decodes the left. The same “high consistency” is a 200k-character archive for gpt-5.6-sol and a 3–6k curated page for claude-fable-5.
Similarity alone certifies nothing, though, and three seeds are what makes that visible: claude-haiku-4.5 averages 0.31 — as close to the good band as the winner — and finishes last. A well-shaped notebook is necessary, not sufficient.
Compute is a null. Total tokens against score gives rs=−0.19 (p=0.50) across a sevenfold spend range, and the null holds under every accounting we tried: cache-inclusive, output-only, and dollars. deepseek-v4-pro spends the most tokens in the field (194M) to finish 9th, gemini-3.5-flash spends 154M to finish 13th, and the winner takes first place on 24M — the smallest budget in the field. grok-4.5 is the honest counter-anchor at 191M tokens for 7th: heavy compute can work, it is just neither necessary nor close to sufficient. Since each model chooses its own number of turns per stop, that spread is a property of the model's behavior, not of the harness.
Two of our metrics failed, and the failures are the reason to run more than one seed. We pre-registered the hypothesis that models with foresight would trigger fewer board warnings. On seed 1 the data came back with the opposite sign (ρ=+0.45); on the second seed it was +0.07, on the third −0.78. Averaged, it is nothing. The reason is that zero warnings has two completely different causes: genuine anticipation, and doing so little that nothing is ever at risk — and nothing is ever built either. A second metric, the share of promoted youth later fielded regularly, looked informative on seed 1 (−0.52) and did not survive the others (−0.18, +0.04). Tactic reversals went the same way and was dropped as an axis, though the raw spread is worth recording: zero reversals for the winner in all three worlds, against 31 on average for claude-haiku-4.5. All three stay in the report as negative results. A benchmark that only ever publishes the metrics that worked is not telling you how it was built.
Three seeds are enough to show that adjacent models do not separate and that spread differs sharply by model; they are not enough for inferential claims about any single pair, and the Arena remains one shared world with no error bars. A behavioral metric can also always be contaminated by something other than the capability it is named after. The causal probes that would settle that — a notebook ablation, and injecting a fixed high-quality plan to separate formulating a plan from retaining and executing one — are the next round.
Full method, every figure, the limitations in detail, and a capability profile for each of the 15 models: Capability anatomy: the six behavioral capabilities behind the score →
The Environment Underneath
Underneath the leaderboard is a deterministic, seeded simulation engine that steps a full 20-year run in about 76 seconds on one core with no agent in the loop. Every model meets the same interface: read the state, call tools, get results. The 20-year horizon is just a setting; the same engine generates 5-year or longer worlds. We built the benchmark as the first thing to run on it, and the environment is designed to be reused beyond this leaderboard.
The environment is open source at Analogy-AI/fm-bench — the engine, the 26-tool interface, and the harness that produced both boards.
Official runs are operated by us end to end, on a frozen world with an audited protocol and full replay verification: before publication, every run is reproduced bit-exactly from its seed and action log, and a run whose score does not replay is not published. That is the standard we intend to hold every board to — FM-Bench is the first of a set of long-horizon agentic environments we are building.
To put your model on the leaderboard, or to use the environment for your own research or training, contact us.